Today we will draw a graph using the data from the PMS7003 fine dust sensor. When I compiled the code I uploaded last time, I suddenly got a compile error.

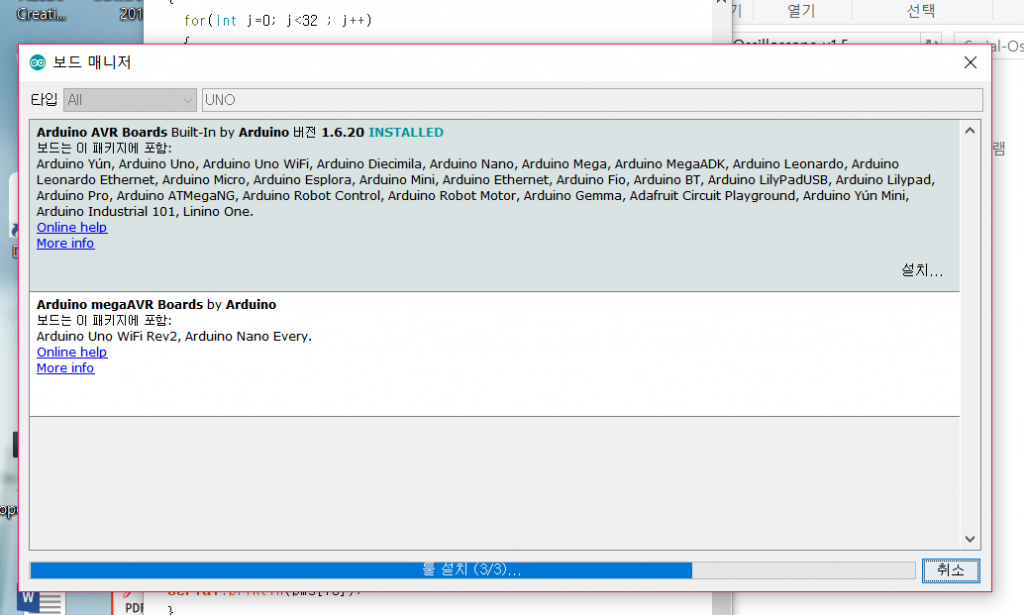
While looking for the reason, I found that I did not update the Arduino / Genuino UNO board version. So I entered board manager and upgraded to the latest version.

Then it compiles well.

Next you need to download the oscilloscope program. You can download it from the following link.
When you run the program, the following main screen appears. The first thing to do is to match the serial port. And set the same baud rate as you set in Arduino. Then click on oscilloscope channels 1,2,3 to see the graph.

Here’s the Python code I used to try to plot a graph in Python.
import serial
from numpy import *
import matplotlib.pyplot as plt

ard = serial.Serial('COM13', 115200)
#ard = readline() # read "hello python."
ard = flush

lstX = []
lstY = []

plt.ion()
fig = plt.figure()
sf = fig.add_subplot(!11)
plt.xlim([0, 60])
plt.ylim([0, 100])
line1, = sf.plot(arrX, arrY, '-r')

while True:
    bytesR = ard.readline()
    lstR = eval(bytesR[:-2].decode())

    timeR = 1stR[0]/1000.0
    lstX.append(timeR)
    lstY.append(1stR[1])

    line1.set_xdata(1stX)
    line1.set_ydata(1stY)

    plt.draw(), plt.pause(0.00001)
    print('time:%3fs, value:%d' % (timeR, lst[1]))

au.close

