Decision trees are a popular model for classification and regression problems. Basically, decision trees learn from yes to no questions in order to reach a decision.
In other words, it is a tree representing a prediction / classification model that represents a pattern inherent in the data as a combination of variables. Narrow down the object we are thinking of as we get right by asking questions. It is like a twenty-question game.
Outline of Decision Tree

For example, suppose you have the following data set: The algorithm is simple. Split data into two or more subsets. This is to make the data uniform. Classification is the collection of observations with similar categories. Prediction is the collection of observations with similar numbers.

In the figure above, the nodes in the tree are square boxes containing questions or answers. The last node is also called a leaf-node. The first node is called the root node.

Classified Tree Model – information gain
Response values y_i = 1, 2, ,,,, k for each observation. There are k classes. The ratio of the observations belonging to the k class at the end node m is as follows.

If the entropy is changed from 1 to 0.7, the information gain is 0.3. The amount of information obtained is the entropy before the quarter minus the entropy after the quarter. It can be formulated as follows:
Information gain = entropy (parent)-[weighted average] entropy (children)
The decision tree algorithm learns in the direction of maximizing information gain. The branch proceeds by determining which information gain is maximized at which branch of which feature.
Cost function (impurity measurement) in classification model
By default, gini impurity is used, but you can use entropy impurity by setting the criterion parameter to “entropy”.
Entropy: The original concept of thermodynamics as a measure of the disorder of molecules. If a set contains only samples of one class, entropy is zero.
Normally, genie impurity and entropy are not much different, but when a new different tree is created, it tends to isolate the most frequent class of genie impurity into one branch, while entropy creates a more balanced tree.

Impurity is how much different data is mixed in that category. In the figure below, the upper category has lower impurity and the lower category has higher impurity. In other words, the upper category has higher purity and the lower category has lower purity. The upper category is all red, but only one blue, so the impurity is low. On the other hand, the lower categories are five blue dots and three red dots, which contain a lot of different data, resulting in high impurity.
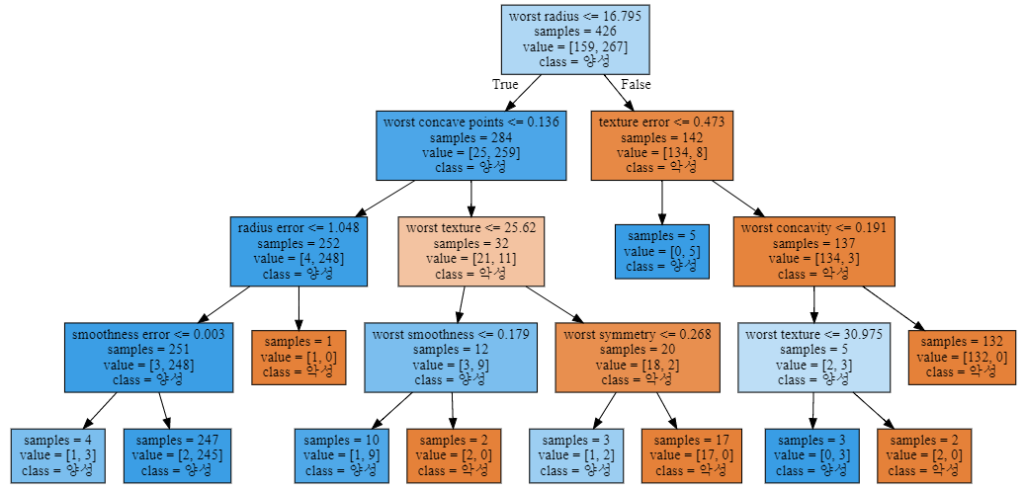
Decision Tree Analysis
from sklearn.tree import export_graphviz
export_graphviz(tree, out_file="tree.dot", class_names=["악성", "양성"],
                feature_names=cancer.feature_names, impurity=False, filled=True)
import graphviz

with open("tree.dot") as f:
    dot_graph = f.read()
display(graphviz.Source(dot_graph))

print("특성 중요도:\n", tree.feature_importances_)

def plot_feature_importances_cancer(model):
    n_features = cancer.data.shape[1]
    plt.barh(np.arange(n_features), model.feature_importances_, align='center')
    plt.yticks(np.arange(n_features), cancer.feature_names)
    plt.xlabel("특성 중요도")
    plt.ylabel("특성")
    plt.ylim(-1, n_features)

plot_feature_importances_cancer(tree)


Long time supporter, and thought I’d drop a comment.
Your wordpress site is very sleek – hope you don’t mind me asking
what theme you’re using? (and don’t mind if I steal it?
:P)
I just launched my site –also built in wordpress like yours– but the theme slows (!) the site down quite a bit.
In case you have a minute, you can find it by
searching for “royal cbd” on Google (would appreciate any feedback) –
it’s still in the works.
Keep up the good work– and hope you all take care of yourself during
the coronavirus scare!
I am using Twenty Seventeen Theme.
I just want to mention I’m beginner to blogging and site-building and definitely loved this page. Probably I’m likely to bookmark your website . You definitely come with terrific well written articles. With thanks for revealing your website page.